SGE Withdrawals 29 MT In Week 16, YTD 635 MT
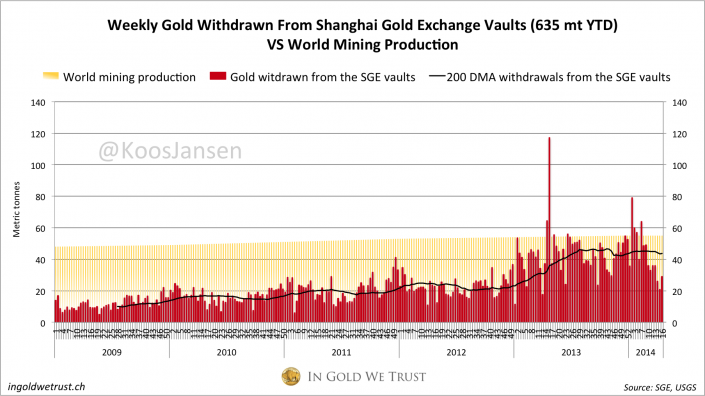
From April 14 to 18, week 16, 29 metric tonnes of gold were withdrawn from the vaults of the Shanghai Gold Exchange. In week 15 it was 21 tonnes, so demand, which equals SGE withdrawals, is slightly picking up. Although it’s nowhere near the figures we saw in the beginning of this year, when there were four weeks when SGE withdrawals transcended global mining production. Lets’ put some weekly numbers in perspective.
2197 tonnes were withdrawn in total in 2013, which was an average of 42.25 tonnes (2197/52) per week. The year to date weekly average is 39.68 tonnes, heading for 2036 tonnes in total in 2014 – though I think it’s impossible to make a fair estimate for this year’s total. The price of gold could be heading lower sparking another buying spree as happened in April 2013, or the price could go higher, possibly slowing down global gold distribution and SGE withdrawals.
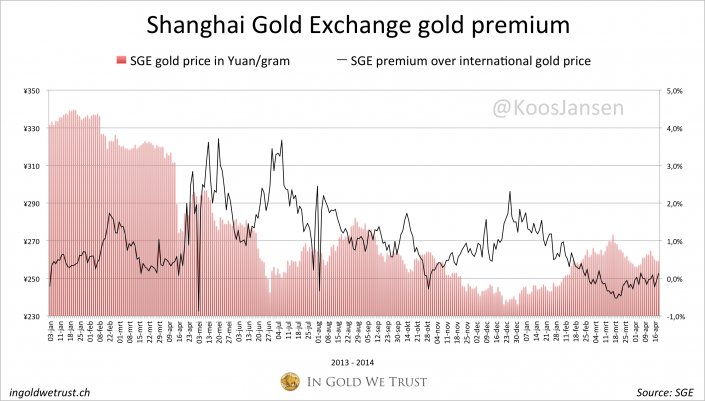
However, in my opinion it’s unlikely withdrawals will stay below 35 tonnes a week at current prices. If we look at the six months period before April 2013, the weekly SGE withdrawal average was 34 tonnes, while the price of gold hovered around $1700 back then. I can’t think of any reason why the Chinese would buy less gold, the precious metal they recognize for its true value, when gold is dirt cheap at $1300. One reason that certainly would dampen SGE withdrawals would be western supply running dry – most of Chinese gold demand is supplied by imports – but from looking at SGE premiums this is not the case yet, as premiums have been negative/zero since weeks.
Overview Shanghai Gold Exchange data 2014 week 16
– 29 metric tonnes withdrawn in week 16 (14-04-2014/18-04-2014)
– w/w + 35.22 %
– 635 metric tonnes withdrawn year to date, + 10 % year to date.
My research indicates that SGE withdrawals equal Chinese wholesale gold demand. For more information read this.
This is a screen shot from the weekly Chinese SGE trade report; the second number from the left (blue – 本周交割量) is weekly gold withdrawn from the vaults in Kg, the second number from the right (green – 累计交割量) is the total YTD.
This chart shows SGE gold premiums based on data from the SGE weekly reports (it’s the difference between the SGE gold price in yuan and the international gold price in yuan).
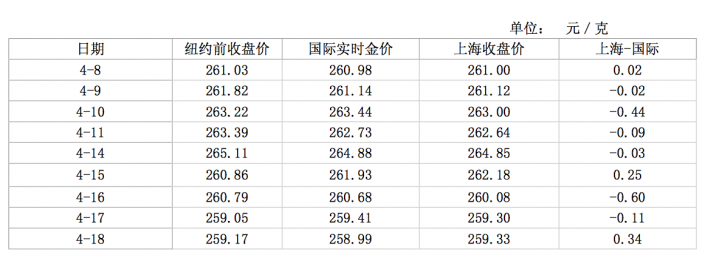
Below is a screen shot of the premium section of the SGE weekly report; the first column is the date, the third is the international gold price in yuan, the fourth is the SGE price in yuan, and the last is the difference.
In Gold We trust
Popular Blog Posts by Koos Jansen
 China’s Secret Gold Supplier is Singapore
 Audits of U.S. Monetary Gold Severely Lack Credibility
 China Gold Import Jan-Sep 797t. Who’s Supplying?
 The Gold-Backed-Oil-Yuan Futures Contract Myth
 Estimated Chinese Gold Reserves Surpass 20,000t
 Did the Dutch Central Bank Lie About Its Gold Bar List?
 PBOC Gold Purchases: Separating Facts from Speculation
 U.S. Mint Releases New Fort Knox Audit Documentation
 China Net Imported 1,300t of Gold in 2016
 Why SGE Withdrawals Equal Chinese Gold Demand and Why Not


 Koos Jansen